What is Observability?
Network data capture with the intelligence needed for actionable metrics and optimized reliability.
Observability is defined as the ability to measure the internal state of a system based on only external information (outputs). The goal of observability in network computing is to answer any question about a network quickly and easily. These “questions” can lead to the quick resolution of network performance issues, including when and why they occurred, and how to correct and prevent them.
Mathematically, observability is a component of control theory, which is based on the relationships between system feedback and performance. Control theory includes setting inputs to produce desired outcomes (controllability) and measuring outputs to understand the system condition (observability). These concepts have many applications in engineering, avionics, and other fields. Network observability solutions apply the observability definition to the intelligent, interactive collection and analysis of data across distributed networks. The desired outcome for network observability solutions is to ensure smooth, continuous service delivery for end-users.
The similarities between monitoring and observability can lead to confusion. Both practices utilize data capture, trending, and dashboards to increase visibility and identify failures. The differences between them underscore the reasons why observability is important for more complex, distributed networks.
- Monitoring is a passive surveillance and data collection practice used to measure performance against pre-defined standards. Monitoring tools have been developed over the years based on more traditional, static network environments without cloud components or frequent changes. Monitoring solutions can usually tell when errors are occurring but lack context regarding what led up to them.
- Network observability is intended to facilitate a deep understanding of network health, with a focus on ensuring that the end-user’s experience is optimal. This includes decoding the dependencies within the network that can ultimately lead to errors or directly impact service quality. This level of insight allows more dynamic network environments to be understood. The impact of new software, hardware, traffic surges, and other forms of variation can then be predicted so that proactive corrective actions can be taken.
- The difference between monitoring and observability comes down to the nature of passive collection of statistics vs. in-depth automated analysis. Network monitoring might include data collection and alerts based on downtime, connectivity, or service degradation, but does not provide the deeper cause and effect insight or hypothetical exploration of unknowns offered by an observability platform.
Why is Observability of the Network Important?
Changes to the IT landscape resulting in increased network reliance have been accelerated by the pandemic and home-based work. Applications are rapidly moving from on-premise to the cloud, with new infrastructure devices deployed every day. This makes the need for improved network observability more important than ever.
- Distributed networks are by definition complex systems with decentralized, interconnected nodes spanning vast geographic areas. Network professionals need to triangulate to problematic devices or review multiple logs to determine what changed. IT observability can help to offload and automate root cause analysis, capacity planning, and network mapping for distributed networks.
- Hybrid cloud environments have become commonplace with the majority of enterprises already leveraging cloud applications to support their existing on-premise networks. The flexibility and productivity gained through hybrid cloud strategies can be undermined by a lack of visibility into network elements outside of the direct control of the organization. Observability platforms can be extended into these hybrid environments to analyze interfaces with existing infrastructure and users.
- Cloud native observability produces higher levels of insight into cloud-native applications and services, despite an inherent lack of ownership and access. Cloud observability practices achieve this through the intelligent collection and analysis of virtual machine (VM) data, event logs, traces, and other cloud data sources. Trace analysis can be utilized by the observability platform to determine which logs are most relevant.
Value of Observability to Drive Optimal Service Delivery
The value of observability can be measured by the impact on service delivery and user satisfaction. Smooth and secure delivery of services and applications are what customers need and expect. Degradation or outright loss of systems can become catastrophic in many verticals.
- Network downtime directly impacts the bottom line by taking time and value away from activities that drive digital transformation. Studies indicate that approximately 38% of U.S. organizations lost $1 million of more due to network downtime in 2020, with many losing $1 million or more from a single outage.
- Reliable service delivery has gone from a luxury to an absolute necessity in many industries where systems must remain running at all costs. The “cost” for this peace of mind is an effective observability platform that builds supreme confidence in network reliability.
- Financial services are now based on split-second timing of information delivery and trading. These services must remain accurate for providers to avoid costly regulatory and public-relations penalties.
- The healthcare industry has fully embraced the IoT, virtual consultations and even major surgery performed via robot-enabled remote control. The severe consequences of degraded or interrupted service delivery are obvious.
- Manufacturing operations continue to rely on dependable services delivery as robotics and automation evolve. Line stoppages for many large manufacturers can cost millions of dollars in a matter of hours.
- Security remediation is an additional high-value benefit of observability data. To contain the scope and impact of a security breach, the point of access, impacted devices, and path of the rogue host through the network must be instantly retrievable. An IT observability platform provides the visibility and intelligence needed to minimize the frequency and impact of security breaches.
While the benefits are obvious, there are stumbling blocks on the road to observability. Some are encountered during the initial stages of deployment as the team and processes are defined. Adhering to a few observability best practices throughout the network lifecycle can lead to improved results and ROI.
Multiple Data Sources
- Hi-fidelity, real time observability data obtained from multiple sources throughout the network is essential. Some of the more valuable end-to-end data sources include:
- Flow data includes useful digital records that describe communication channels based on IP addresses, port numbers, protocols followed, and network interfaces.
- Syslog messages are based on a common logging protocol and contain time-stamped information on network device status, events, and severity levels.
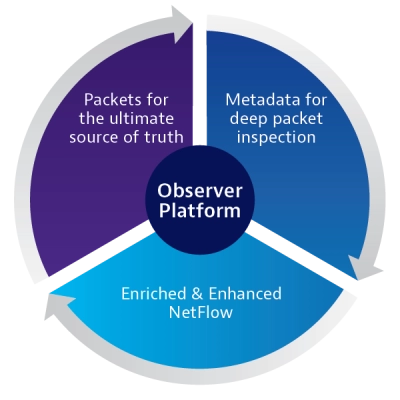
- Metadata is packet data that has been collected and sorted to provide higher level statistics on network traffic, usage, and performance.

- Enriched Flow Data
Unique in the industry, the VIAVI Observer network observability solution utilizes multiple data sources to create one comprehensive enriched flow record. These sources include device IP and directory data, traditional network flow data, cloud service logs, and user information obtained from domain/authentication servers. - End User Experience
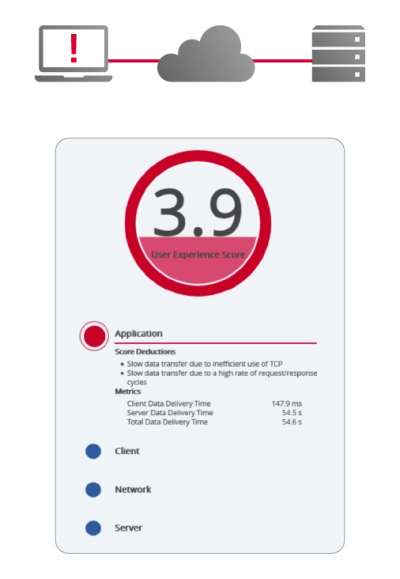
With user satisfaction driving the objectives of network observability, intelligent use of user experience data is a fundamental observability best practice. The VIAVI Observer platform has incorporated advanced End-User Experience (EUE) scoring, a composite metric based on service anomalies detected through packet-based data analysis. Individual or rolled-up scores are color coded for added visibility and intelligently associated to server, application, or client-based anomalies.

- What You Do with the Data
Analyzing a wealth of data to produce actionable insights is where real magic of observability occurs. Clear and concise workflows and dashboards can help to facilitate problem resolution, customer satisfaction, and scalability.
The primary telemetry data sources (logs, metrics, and traces) have been dubbed the three pillars of observability. Visibility across the stack can be achieved through these unique viewpoints. As software, hardware, and networks themselves grow exponentially more complex, the pillars alone are no longer adequate. Even with a deeper level of data aggregation and analysis, a new observability paradigm is called for.
This new model is based on a pyramid or hierarchy of observability that underpins the sturdy and reliable pillars.
- Network performance monitoring or robust data collection and analysis rests at the top of the pyramid. This includes monitoring of traditional telemetry data along with deep packet inspection and the seamless integration of enriched flow records enabled only by VIAVI observability solutions.
- End-User Experience (EUE) scoring forms the foundation of observability from which all other data sources and metrics can be evaluated. Multi-dimensional EUE scoring combines wire data with the power of machine learning to determine which users are impacted by shifts in network performance, and why. EUE scoring validates the existence of performance issues, provides the scope, severity, and duration details needed to drive prioritization, and automates the process of isolating the problem domain.
Successfully Implementing Observability
Despite the heightened level of insight and performance that accompanies true network observability, deploying a platform need not be overly time-consuming or complex.
Adopting a simple 10-point checklist for up-front observability planning is useful for selecting the right solution and establishing long-term strategies and goals. Once the planning stage has been completed, observability implementation can be broken into logical steps to ensure the software platform supports the needs of the business.
- Installation
- A cross-functional team should be established to assess computing resources and training requirements. Plug and play solutions like the Observer appliance simplify installation with completed licensing and quick start guides.
- Network Discovery and Data Gathering
- Defining the sites and probe locations required to achieve the desired level of visibility is essential. Traffic mirroring from cloud service providers can be used to increase observability AWS and visibility into cloud-hosted applications.
- Using and Configuring Dashboards
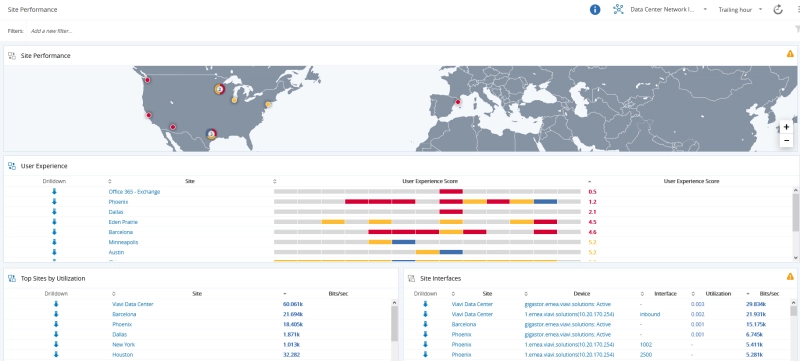
- Dashboard creation is a key to turning data into actionable insights. This can be achieved by creating customized executive-level dashboards that facilitate a quick drill down to underlying causes.
- Managing and Optimizing
- Observability is not for problem resolution alone. Continuous improvement of network performance should be an ongoing focus. Optimizing application observability to streamline data collection practices and dashboards will in turn optimize network performance and capacity.
- Professional Services Ready
- Professional services (PS) from experienced VIAVI experts are available during all phases of Observer deployment. Valuable PS options can support implementation planning and configuration to maximize ROI.
Industry-Leading Observability Solutions from VIAVI
The Observer platform draws upon multiple data sources, including wire data and enriched flow records, to produce industry-leading situational awareness and end user experience scoring.

Observer Apex software seamlessly integrates enriched flow records, captured packet data, and end user scoring analytics to produce intuitive and actionable dashboards and workflows.
As observability solutions continue to evolve and improve, VIAVI has embraced the next generation of observability technologies and practices.
- Observer Platform Demos
- Getting to Root Cause in a Multi-Tier Application
- Speeding Incident Response and Remediation with Full Fidelity Forensics
- Analyzing Corporate Intranet Performance Issues
- The VIAVI Observer platform offers a series of valuable demos that enable you to manage networks and applications using end-user insight, mitigate risks, and resolve issues faster using forensic wire data. The timely and readily available demo topics include:
Continue your Observability education with VIAVI!
Are you ready to take the next step with one of our Observer products or solutions? Complete one of the following forms to continue: